Stephanie Dang: Creating Impact Through Data

Stephanie Dang, MS Data Visualization ’23, enjoys making discoveries as she works. “A lot of my projects start from me learning something I didn’t know, which leads to more questions,” she says.
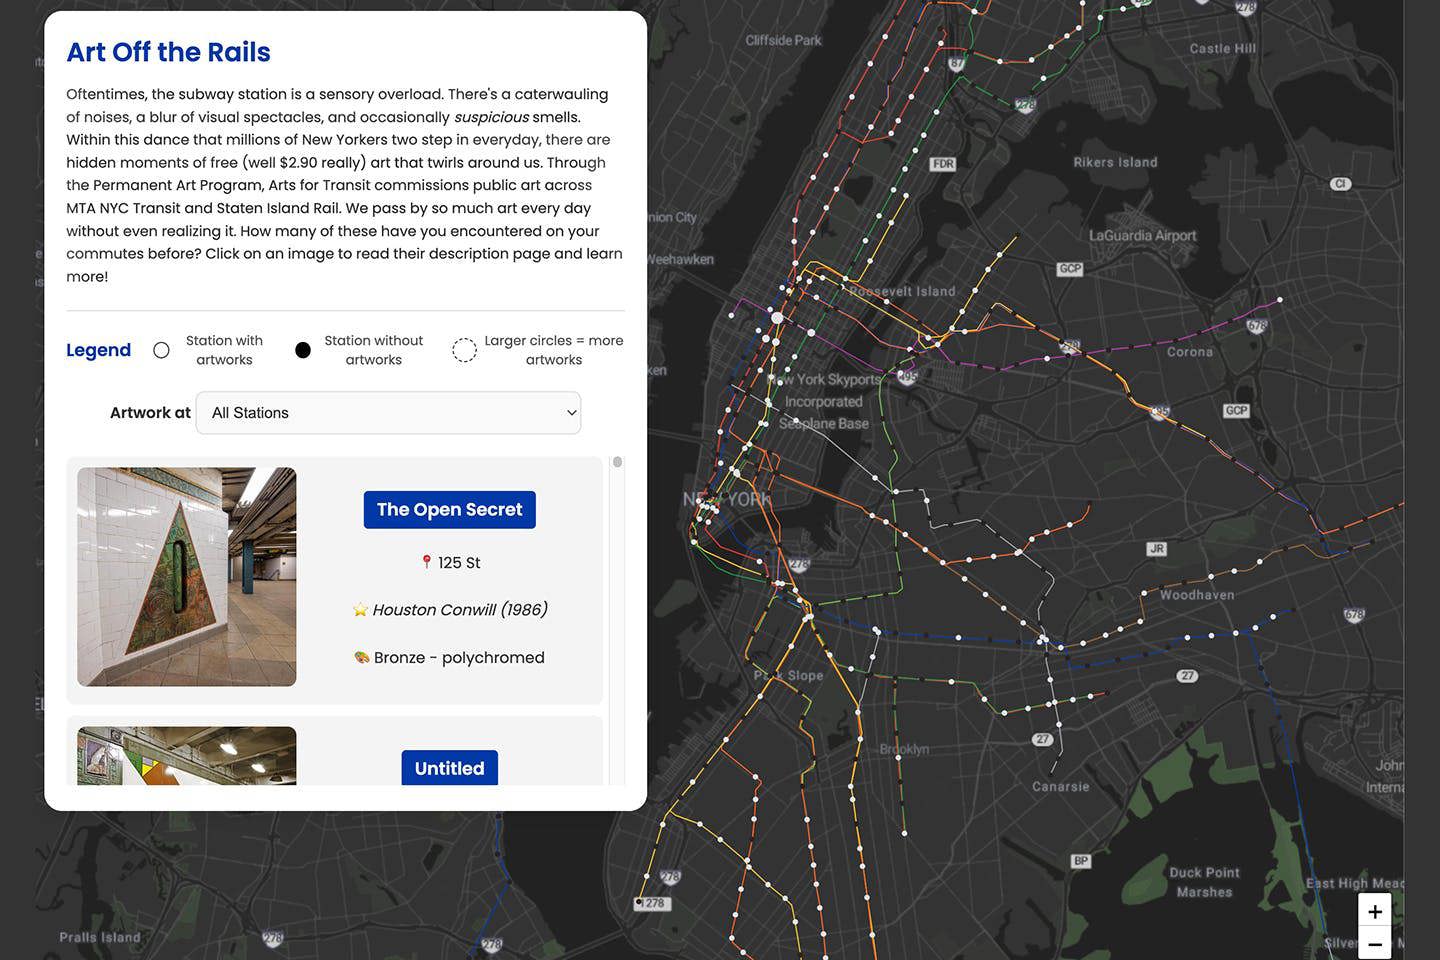
Her inquisitive nature served her well as she developed Art Off the Rails, an interactive map that highlights public art in New York City’s subway stations. The project won the Metropolitan Transit Authority’s 2024 inaugural Open Data Challenge, a competition that tasked participants with using the MTA’s extensive data sets to create projects that offered insights into the city’s transportation system.
Growing up in Southern California, Dang didn’t use public transit regularly. But living in New York gave her a deeper appreciation of its unsung benefits. “People come here to see art in museums, but there is also art in everyday life and places we don’t expect,” Dang says of her project. “Art in urban public spaces is a very gentle form of kindness.”
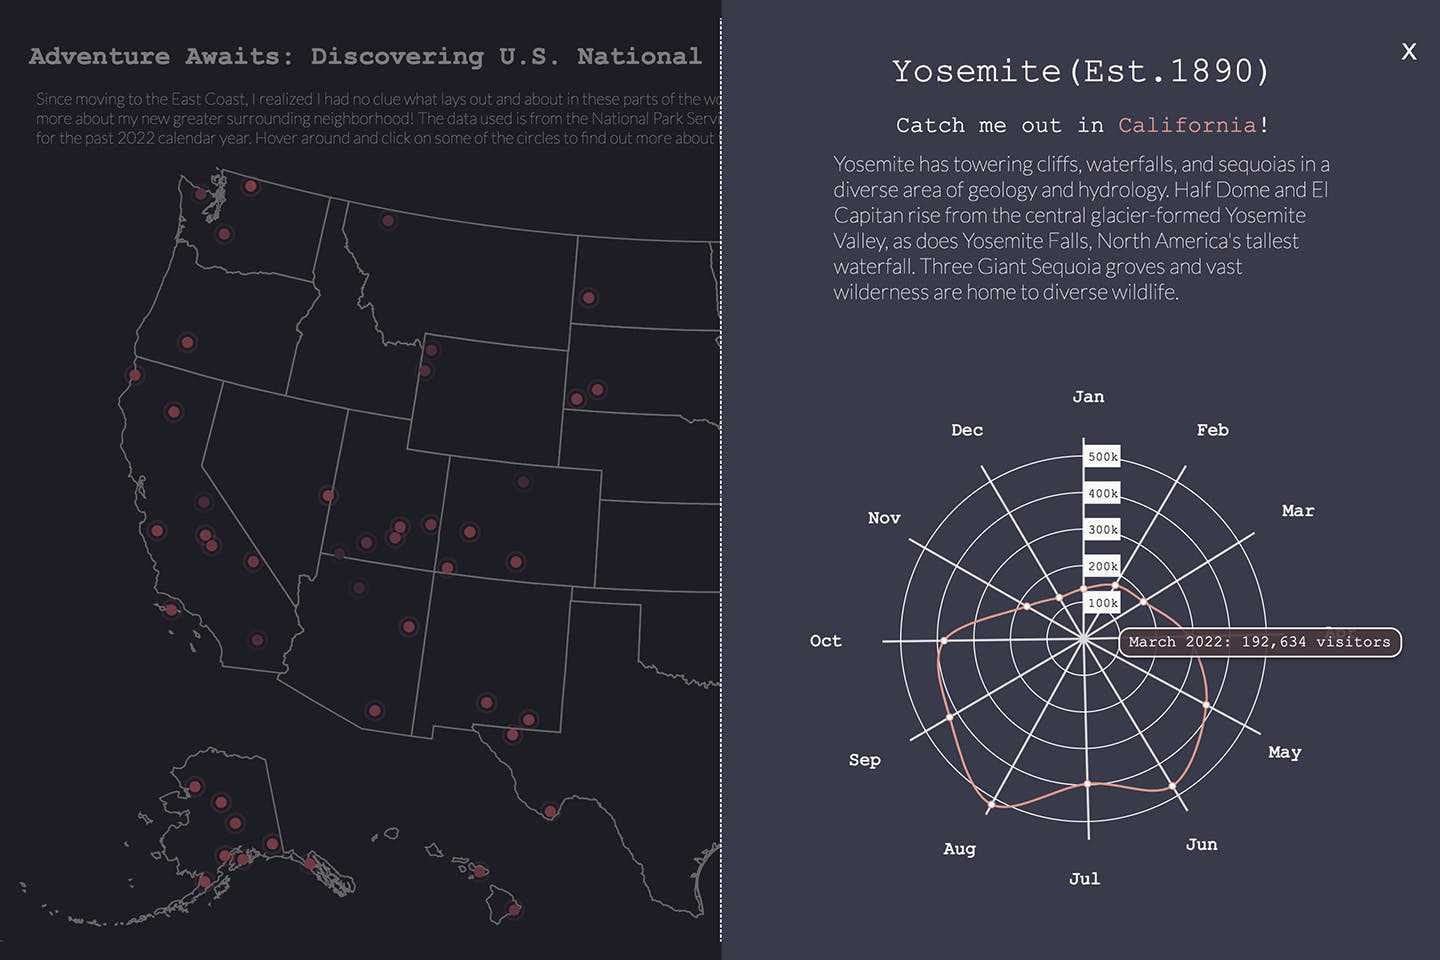
Dang was inspired to apply to Parsons’ MS Data Visualization program after seeing students’ work on the Parsons website. “I was really wowed by the projects,” says Dang, “and they opened my eyes to a type of career that I didn’t know existed.” Being in the program also changed Dang’s perspective on the type of work she wanted to do. “I started to realize during my first semester at Parsons that I don’t want to create things just for myself; I want my work to have a wider impact,” says Dang.
In a studio class, for example, Dang and her classmates worked with United Nations data sets to create narratives around important global issues such as public health, sustainability, and the environment. And the Designing for Usability course, taught by Morry Galonoy, got her thinking about the importance of designing from the perspective of others and finding solutions that work for them. “Parsons kick-started the idea of creating things for the greater good and telling bigger stories,” says Dang.
Dang sees her work as a way to create positive change in the world. “Today we have so much access to so much information that it can be overwhelming,” she says. “Data visualization distills the information and tells stories in creative, engaging, and powerful ways.”